我所渴求的,無非是將心中脫穎語出的本性付諸生活,為何竟如此艱難呢 ——赫尔曼·黑塞《德米安》
写在前面
学习K8s,所以整理分享给小伙伴
这里要说明的是:这一套方案太吃硬件了,需要高配的本才能跑起来
我的16G运存,集群用三个虚机部署的,工作节点都是3核5G的配置
折腾了两天没有跑起来,后来放弃了,查了下,还是资源的问题。浪费了两天的假期:(
然后睡了一觉,起来好了,勉强能跑起来,但是巨卡
博文涉及主要内容
k8s集群helm方式日志管理方案(Elasticsearch+Filebeat+Kibana+Metricbeat)搭建Demo一些搭建过程的避坑说明
部分内容參考
《CKA/CKAD应试指南》《基于Kubernetes的容器云平台实战》《Kubernetes权威指南》
我所渴求的,無非是將心中脫穎語出的本性付諸生活,為何竟如此艱難呢 ——赫尔曼·黑塞《德米安》
方案简述 部署完Kubernetes平台后,会安装运行大量的应用, Kubernetes平台及各种应用系统运行过程中会产生大量的各种各样的系统日志和应用日志,通过对这些日志的采集、传输、存储、分析,掌握系统运行状况,对故障处理、安全审计、行为统计等有非常重要的作用。下面和小伙伴聊聊日志采集、传输、存储及分析的具体方案及实践。
Kubernetes平台上的日志按照运维领域分为应用日志和平台日志.
平台日志主要是指容器云平台执行过程中产生的系统日志应用日志是指租户部署的容器应用所产生的日志。一般容器内的应用日志会通过标准输出设备输出到宿主机,
容器引擎可以通过DockerDeamon来接收和重定向这些日志数据。
在容器中输出到控制台的日志,都会以*-json.log的命名方式保存在/var/lib/docker/containers/目录下
1
2
3
4
5
6
7
8
9
10
11
12
13
14
15
16
17
18
19
20
21
22
┌──[root@vms81.liruilongs.github.io]-[/] └─$cd /var/lib/docker/containers/ ┌──[root@vms81.liruilongs.github.io]-[/var/lib/docker/containers] └─$ls 0606dd217f4f2f315f86fb378ffa65ed0c59ba7580869b9a88634dd6e171fdc0 5fde81847fefef953a4575a98e850ce59e1f12c870c9f3e0707a993b8fbecdf0 a72407dce4ac3cd294f8cd39e3fe9b882cbab98d97ffcfad5595f85fb15fec86 06b93b6329012fe79c746bd1136a73396dfbb616b5cecc6ed36baf06fa5c0ba1 622f9edfcadbe129624c57d36e0f30f0857e1fca942bf3fa43ef8c1ebfcd66dd a9e28c6b2799f4ee6a3c9e3a5aa87b221c005de255b2e26af6269e05e029ca2c 0f527574d23415f46c572eeeb567e91a0e9f8e7257b77a3b12f8c730a4ce02d3 63eb2da8d7b2fa0228b8ab96cf7d324021ef86671d9274671e5cb2742d0ef82c aca4e90b9098278f464a958d867deed97902017021821ce2b4c7a19d101654a6 18915947e8df200e4dee89681d9494caabf123d706a2620b13834bfd66f6d78b 6800a57d9800e8f7a9003b1703874ecb6901e5a405e756615e067ae12d2e73cd cc630cbd652e029ca5e31bef39a9c5ee34edac9bd42290eb3453bb418daa13b6 19f3460f872892d06e0ebae8edf23205f1ee414b50d3369f8fd43c6c1c56f5ca 68932b255da53c87bde7267f4e0cdce62354233ff4edb4c2c5ea3d52678cc7eb d317fec9c72bc6ba8ea269e7d051469812c21fe34ae8f485d771fc0442e726eb 1e0290e55ef51f8244b22fd06ec7ab92ba710bb4020ccbe7e17680fef7123217 717a70f583304f964fe1e49cb70ae5ed0736cc07d3ae99c317d603b6c32a4d7b d935bf0aa2729e97af8cec9f068add2204af58fc274fe0be16de78767f45ae25 2e045fb8b9d0cf9d11942e4d354e5a227d719eb89833c00f10a13ab754c60550 79d7cd4921310c2ebc67f9b991c978315c9976a2fd40259c679a896b360a79c4 df71f8784e0e6edc8ff5d97b75aa02e748afbdf469e887c7b26869918c170057 39155bfd5218c7646d944b91287473c4327df1cf65a75376180243dccbb3d993 8e0790b31b66978013df49d57adeaad6e494fc8300ef60545a09227988610fc2 ea17614942ba0d562064f93601a976887ee2f376a2c53362baf880dbc2c17f9e 3a83887643718df6e59ccdb2fe487dd02ebe0215d23b1c2b7188964efee648d4 9d6e87acdc3a86ed570380210fde566dd3a8238d5229841a5c58bddd70b3164c eebf0c7156b0d092bde382b7faf14b5ce398d18f97709234ff3d2f66ec0bc2f9 3bd8ffe600611bcb97d2e4b3c698092b684a89dfc4217872807a982508c604eb 9e603394e21c0d9217c0d25feae9e728bc028fa350d413dadea9b2b91817fa49 ef6b34f07e2d4c70885729a3055a55d918bd0e4d653ba0b5d81ae51fb4697d1f 3daa58413a70f73224dafcfeb71bd1dae1664e6e83e37524ecf1bd26a0aca8fd 9ebf4fbf13c0c45033123edb3d5f6d4254897739a37295e9b7699e0d40c1005d f106a4acfdb893407bc12a5a2467be0097bbfbadd737cf8f0dc99e111b477d9d 46db748a9a51a0b04fbf96c1f0203db0667bea1fbaf488c7c65f5d3451a2ec7c a12a02457513345604e6251d2c8a286f617e972a800f19e4d04b8888114ea6e8 fcc0a0be4353a25adcf5e6016d5a29d06e27d5945c559c811d19799b340fc962 5983afe06986e8958e417b036e673586358309e87b0e76a407c788a88348e6d7 a66a7eee79ced84e6d9201ee38f9ab887f7bfc0103e1172e107b337108a63638 ff545c3a08264a28968800fe0fb2bbd5f4381029f089e9098c9e1484d310fcc1 ┌──[root@vms81.liruilongs.github.io]-[/var/lib/docker/containers] └─$cd 0606dd217f4f2f315f86fb378ffa65ed0c59ba7580869b9a88634dd6e171fdc0;ls 0606dd217f4f2f315f86fb378ffa65ed0c59ba7580869b9a88634dd6e171fdc0-json.log checkpoints config.v2.json hostconfig.json mounts ┌──[root@vms81.liruilongs.github.io]-[/var/lib/docker/containers/0606dd217f4f2f315f86fb378ffa65ed0c59ba7580869b9a88634dd6e171fdc0] └─$
对于应用日志这种数据量比较大的数据可以考虑通过网络直接重定向到收集器,不必通过文件中转,这样可以一定程度地加快数据流转的速度。对于容器应用数据的收集,由于容器的动态申请和释放的特性,因此日志中能够包含日志来源的拓扑信息和IP地址等身份信息就显得尤为重要。应用日志由于数据量巨大,般应当根据系统确定保存时间,并对存储空间溢出的异常进行保护。
在Kubernetes集群环境中,一个完整的应用或服务都会涉及为数众多的组件运行,各组件所在的Node及实例数量都是可变的。日志子系统如果不做集中化管理,则会系统的运维支撑造成很大的困难,因此有必要在集群层面对日志进行统一收集和检索等工作。所以就有了ELF和EFK
ELK
ELK ElasticSearch、 Logstash, Kibana的简称,是容器日志管理的核心套件。
ElasticSearch:
Logstash:
Kibana:
EFK EFK: fluentd或者filebeat替代
关于日志方案涉及的组件,这里列出官网地址,小伙伴可以去看看
在K8s集群部署统一的日志管理系统,需要以下两个前提条件。
API Server正确配置了CA证书。DNS服务,跨主机组网启动、运行。
需要注意的是,这套方案涉及到RBAC权限处理的一些资源对象,要结合helm中chart的资源文件和当前集群的资源对象版本去修改。关于基于RBAC的权限处理Kubernetes在1.5版本中引入,在1.6版本时升级为Beta版本,在1.8版本时升级为GA,我们这里搭建用的7.9.1版本,RBAC用的Bate的版本,但是集群是1.22的版本,所以需要修改资源文件。
1
2
3
4
5
┌──[root@vms81.liruilongs.github.io]-[~/efk] └─$kubectl api-versions | grep rbac rbac.authorization.k8s.io/v1 ┌──[root@vms81.liruilongs.github.io]-[~/efk] └─$
架构简述 关于搭建的架构。我们这里简单描述下,其实和我之前讲的k8s集群监控类似,下面为我们搭建好的EFK相关的pod列表,我们可以看到,elasticsearch集群作为日志存储平台,向上对接kibana(kibana是一个Web应用,用于调用接口查询elasticsearch集群的数据),向下对接metricbeat,filebeat,这两个组件主要用于工作节点的日志采集,采集完日志给elasticsearch集群
1
2
3
4
5
6
7
8
9
10
11
12
13
14
15
16
┌──[root@vms81.liruilongs.github.io]-[~/ansible/k8s-helm-create/metricbeat] └─$kubectl get pods -o wide NAME READY STATUS RESTARTS AGE IP NODE NOMINATED NODE READINESS GATES .... elasticsearch-master-0 1/1 Running 2 (3h21m ago) 3h55m 10.244.70.40 vms83.liruilongs.github.io <none> <none> elasticsearch-master-1 1/1 Running 2 (3h21m ago) 3h55m 10.244.171.163 vms82.liruilongs.github.io <none> <none> filebeat-filebeat-64f5b 1/1 Running 7 (168m ago) 3h54m 10.244.70.36 vms83.liruilongs.github.io <none> <none> filebeat-filebeat-g4cw8 1/1 Running 8 (168m ago) 3h54m 10.244.171.185 vms82.liruilongs.github.io <none> <none> kibana-kibana-f88767f86-vqnms 1/1 Running 8 (167m ago) 3h57m 10.244.171.159 vms82.liruilongs.github.io <none> <none> ........ metricbeat-kube-state-metrics-75c5fc65d9-86fvh 1/1 Running 0 13m 10.244.70.43 vms83.liruilongs.github.io <none> <none> metricbeat-metricbeat-895qz 1/1 Running 0 13m 10.244.171.172 vms82.liruilongs.github.io <none> <none> metricbeat-metricbeat-metrics-7c5cd7d77f-22fgr 1/1 Running 0 13m 10.244.70.45 vms83.liruilongs.github.io <none> <none> metricbeat-metricbeat-n2gx2 1/1 Running 0 13m 10.244.70.46 vms83.liruilongs.github.io <none> <none> .........
搭建环境 helm版本 1 2 3 ┌──[root@vms81.liruilongs.github.io]-[/var/lib/docker/containers/0606dd217f4f2f315f86fb378ffa65ed0c59ba7580869b9a88634dd6e171fdc0] └─$helm version version.BuildInfo{Version:"v3.2.1" , GitCommit:"fe51cd1e31e6a202cba7dead9552a6d418ded79a" , GitTreeState:"clean" , GoVersion:"go1.13.10" }
k8s集群版本 1 2 3 4 5 6 ┌──[root@vms81.liruilongs.github.io]-[/var/lib/docker/containers/0606dd217f4f2f315f86fb378ffa65ed0c59ba7580869b9a88634dd6e171fdc0] └─$kubectl get nodes NAME STATUS ROLES AGE VERSION vms81.liruilongs.github.io Ready control-plane,master 54d v1.22.2 vms82.liruilongs.github.io Ready <none> 54d v1.22.2 vms83.liruilongs.github.io Ready <none> 54d v1.22.2
EFK(helm)源设置 1 2 3 ┌──[root@vms81.liruilongs.github.io]-[~/ansible/k8s-helm-create] └─$helm repo add elastic https://helm.elastic.co "elastic" has been added to your repositories
1 2 3 4 5 6 7 8 9 ┌──[root@vms81.liruilongs.github.io]-[~/ansible/k8s-helm-create] └─$helm repo list NAME URL azure http://mirror.azure.cn/kubernetes/charts/ ali https://apphub.aliyuncs.com liruilong_repo http://192.168.26.83:8080/charts stable https://charts.helm.sh/stable prometheus-community https://prometheus-community.github.io/helm-charts elastic https://helm.elastic.co
安装的版本为: –version=7.9.1
EFK chart包下载 1 2 3 4 5 6 7 8 ┌──[root@vms81.liruilongs.github.io]-[~/ansible/k8s-helm-create] └─$helm pull elastic/elasticsearch --version=7.9.1 ┌──[root@vms81.liruilongs.github.io]-[~/ansible/k8s-helm-create] └─$helm pull elastic/filebeat --version=7.9.1 ┌──[root@vms81.liruilongs.github.io]-[~/ansible/k8s-helm-create] └─$helm pull elastic/metricbeat --version=7.9.1 ┌──[root@vms81.liruilongs.github.io]-[~/ansible/k8s-helm-create] └─$helm pull elastic/kibana --version=7.9.1
查看chart下载列表,下载好之后直接通过tar zxf 解压即可
1 2 3 ┌──[root@vms81.liruilongs.github.io]-[~/ansible/k8s-helm-create] └─$ls *7.9.1* elasticsearch-7.9.1.tgz filebeat-7.9.1.tgz kibana-7.9.1.tgz metricbeat-7.9.1.tgz
涉及到的相关镜像导入 需要注意的是,这里镜像下载特别费时间,最好提前下载一下,下面是我在所以工作节点导入的命令,要注意所以的节点都需要导入
1 2 3 4 5 6 7 8 9 10 11 12 13 14 15 16 17 18 ┌──[root@vms82.liruilongs.github.io]-[/] └─$docker load -i elastic7.9.1.tar .... Loaded image: docker.elastic.co/elasticsearch/elasticsearch:7.9.1 ┌──[root@vms82.liruilongs.github.io]-[/] └─$docker load -i filebeat7.9.1.tar .... Loaded image: docker.elastic.co/beats/filebeat:7.9.1 ┌──[root@vms82.liruilongs.github.io]-[/] └─$docker load -i kibana7.9.1.tar .... Loaded image: docker.elastic.co/kibana/kibana:7.9.1 ┌──[root@vms82.liruilongs.github.io]-[/] └─$docker load -i metricbeat7.9.1.tar ..... Loaded image: docker.elastic.co/beats/metricbeat:7.9.1 ┌──[root@vms82.liruilongs.github.io]-[/] └─$
EFK heml安装 这里需要注意的是,我们还需要修改一些配置文件,根据集群的情况
elasticsearch安装 es集群参数的修改 1 2 3 4 5 ┌──[root@vms81.liruilongs.github.io]-[~/ansible/k8s-helm-create] └─$cd elasticsearch/ ┌──[root@vms81.liruilongs.github.io]-[~/ansible/k8s-helm-create/elasticsearch] └─$ls Chart.yaml examples Makefile README.md templates values.yaml
修改集群副本数为2,我们只有2个工作节点,所以只能部署两个
1 2 3 4 5 6 7 8 9 10 ┌──[root@vms81.liruilongs.github.io]-[~/ansible/k8s-helm-create/elasticsearch] └─$cat values.yaml | grep repli replicas: 3 ┌──[root@vms81.liruilongs.github.io]-[~/ansible/k8s-helm-create/elasticsearch] └─$sed 's#replicas: 3#replicas: 2#g' values.yaml | grep replicas: replicas: 2 ┌──[root@vms81.liruilongs.github.io]-[~/ansible/k8s-helm-create/elasticsearch] └─$sed -i 's#replicas: 3#replicas: 2#g' values.yaml
修改集群最小master节点数为1
1 2 3 4 5 6 ┌──[root@vms81.liruilongs.github.io]-[~/ansible/k8s-helm-create/elasticsearch] └─$cat values.yaml | grep mini minimumMasterNodes: 2 ┌──[root@vms81.liruilongs.github.io]-[~/ansible/k8s-helm-create/elasticsearch] └─$sed -i 's#minimumMasterNodes: 2#minimumMasterNodes: 1#g' values.yaml
修改数据持续化方式,这里修改不持久化
1 2 3 4 5 6 7 ┌──[root@vms81.liruilongs.github.io]-[~/ansible/k8s-helm-create/elasticsearch] └─$cat values.yaml | grep -A 2 persistence: persistence: enabled: false labels: ┌──[root@vms81.liruilongs.github.io]-[~/ansible/k8s-helm-create/elasticsearch] └─$
安裝elasticsearch 1 2 3 4 5 6 7 8 9 10 11 12 ┌──[root@vms81.liruilongs.github.io]-[~/ansible/k8s-helm-create] └─$helm install elasticsearch elasticsearch NAME: elasticsearch LAST DEPLOYED: Sat Feb 5 03:15:45 2022 NAMESPACE: kube-system STATUS: deployed REVISION: 1 NOTES: 1. Watch all cluster members come up. $ kubectl get pods --namespace=kube-system -l app=elasticsearch-master -w 2. Test cluster health using Helm test . $ helm test elasticsearch --cleanup
1 2 3 4 5 6 ┌──[root@vms81.liruilongs.github.io]-[~/ansible/k8s-helm-create] └─$kubectl get pods --namespace=kube-system -l app=elasticsearch-master -w NAME READY STATUS RESTARTS AGE elasticsearch-master-0 0/1 Running 0 41s elasticsearch-master-1 0/1 Running 0 41s
等待一些时间,查看pod状态,elasticsearc集群安装成功
1 2 3 4 5 6 7 ┌──[root@vms81.liruilongs.github.io]-[~/ansible/k8s-helm-create] └─$kubectl get pods --namespace=kube-system -l app=elasticsearch-master NAME READY STATUS RESTARTS AGE elasticsearch-master-0 1/1 Running 0 2m23s elasticsearch-master-1 1/1 Running 0 2m23s ┌──[root@vms81.liruilongs.github.io]-[~/ansible/k8s-helm-create] └─$
metricbeat 安装 metricbeat的安装就需要注意资源文件的版本问题,直接安装会包如下错误
报错问题解决 1 2 3 ┌──[root@vms81.liruilongs.github.io]-[~/ansible/k8s-helm-create/metricbeat] └─$helm install metricbeat . Error: unable to build kubernetes objects from release manifest: [unable to recognize "" : no matches for kind "ClusterRole" in version "rbac.authorization.k8s.io/v1beta1" , unable to recognize "" : no matches for kind "ClusterRoleBinding" in version "rbac.authorization.k8s.io/v1beta1" ]
解决办法,涉及到版本的直接修改
1 2 ┌──[root@vms81.liruilongs.github.io]-[~/ansible/k8s-helm-create/metricbeat/charts/kube-state-metrics/templates] └─$sed -i 's#rbac.authorization.k8s.io/v1beta1#rbac.authorization.k8s.io/v1#g' *.yaml
1 2 3 4 5 6 7 8 9 10 11 ┌──[root@vms81.liruilongs.github.io]-[~/ansible/k8s-helm-create/metricbeat] └─$helm install metricbeat . NAME: metricbeat LAST DEPLOYED: Sat Feb 5 03:42:48 2022 NAMESPACE: kube-system STATUS: deployed REVISION: 1 TEST SUITE: None NOTES: 1. Watch all containers come up. $ kubectl get pods --namespace=kube-system -l app=metricbeat-metricbeat -w
1 2 3 4 5 ┌──[root@vms81.liruilongs.github.io]-[~/ansible/k8s-helm-create/metricbeat] └─$kubectl get pods --namespace=kube-system -l app=metricbeat-metricbeat NAME READY STATUS RESTARTS AGE metricbeat-metricbeat-cvqsm 1/1 Running 0 65s metricbeat-metricbeat-gfdqz 1/1 Running 0 65s
filebeat安装 安装filebeat 1 2 3 4 5 6 7 8 9 10 11 ┌──[root@vms81.liruilongs.github.io]-[~/ansible/k8s-helm-create/filebeat] └─$helm install filebeat . NAME: filebeat LAST DEPLOYED: Sat Feb 5 03:27:13 2022 NAMESPACE: kube-system STATUS: deployed REVISION: 1 TEST SUITE: None NOTES: 1. Watch all containers come up. $ kubectl get pods --namespace=kube-system -l app=filebeat-filebeat -w
过一会时间查看pod状态,安装成功
1 2 3 4 5 ┌──[root@vms81.liruilongs.github.io]-[~/ansible/k8s-helm-create/filebeat] └─$kubectl get pods --namespace=kube-system -l app=filebeat-filebeat -w NAME READY STATUS RESTARTS AGE filebeat-filebeat-df4s4 1/1 Running 0 20s filebeat-filebeat-hw9xh 1/1 Running 0 21s
kibana 安装 修改SVC类型 这里需要注意的是,我么需要找集群外部访问,所以SVC需要修改为NodePort
1 2 3 4 5 6 7 8 9 10 11 12 13 ┌──[root@vms81.liruilongs.github.io]-[~/ansible/k8s-helm-create/kibana] └─$cat values.yaml | grep -A 2 "type: ClusterIP" type : ClusterIP loadBalancerIP: "" port: 5601 ┌──[root@vms81.liruilongs.github.io]-[~/ansible/k8s-helm-create/kibana] └─$sed -i 's#type: ClusterIP#type: NodePort#g' values.yaml ┌──[root@vms81.liruilongs.github.io]-[~/ansible/k8s-helm-create/kibana] └─$cat values.yaml | grep -A 3 service: service: type : NodePort loadBalancerIP: "" port: 5601
安装kibana 1 2 3 4 5 6 7 8 ┌──[root@vms81.liruilongs.github.io]-[~/ansible/k8s-helm-create/kibana] └─$helm install kibana . NAME: kibana LAST DEPLOYED: Sat Feb 5 03:47:07 2022 NAMESPACE: kube-system STATUS: deployed REVISION: 1 TEST SUITE: None
pending解决 一直创建不成功,我们查看事件,发现是CPU和内存不够,没办法,这里只能重新调整虚机资源
1 2 3 4 5 6 7 8 9 10 11 12 ┌──[root@vms81.liruilongs.github.io]-[~/ansible/k8s-helm-create/kibana] └─$kubectl get pods kibana-kibana-f88767f86-fsbhf NAME READY STATUS RESTARTS AGE kibana-kibana-f88767f86-fsbhf 0/1 Pending 0 6m14s ┌──[root@vms81.liruilongs.github.io]-[~/ansible/k8s-helm-create/kibana] └─$kubectl describe pods kibana-kibana-f88767f86-fsbhf | grep -A 10 -i events Events: Type Reason Age From Message ---- ------ ---- ---- ------- Warning FailedScheduling 4s (x7 over 6m33s) default-scheduler 0/3 nodes are available: 1 node(s) had taint {node-role.kubernetes.io/master: }, that the pod didn't tolerate, 2 Insufficient cpu, 2 Insufficient memory. ┌──[root@vms81.liruilongs.github.io]-[~/ansible/k8s-helm-create/kibana] └─$
调整完资源可能还会报这样的错,查了下,还是资源的问题,我的资源没办法调整了,后就休息了,睡起来发现可以了
1 Readiness probe failed: Error: Got HTTP code 000 but expected a 200
1 2 3 4 5 6 7 8 9 10 11 12 13 ┌──[root@vms81.liruilongs.github.io]-[~/ansible/k8s-helm-create] └─$kubectl describe pods kibana-kibana-f88767f86-qkrk7 | grep -i -A 10 event Events: Type Reason Age From Message ---- ------ ---- ---- ------- Normal Scheduled 8m21s default-scheduler Successfully assigned kube-system/kibana-kibana-f88767f86-qkrk7 to vms83.liruilongs.github.io Normal Pulled 7m42s kubelet Container image "docker.elastic.co/kibana/kibana:7.9.1" already present on machine Normal Created 7m42s kubelet Created container kibana Normal Started 7m41s kubelet Started container kibana Warning Unhealthy 4m17s (x19 over 7m30s) kubelet Readiness probe failed: Error: Got HTTP code 000 but expected a 200 Warning Unhealthy 2m19s (x6 over 7m5s) kubelet Readiness probe failed: ┌──[root@vms81.liruilongs.github.io]-[~/ansible/k8s-helm-create] └─$
下面是一些解决办法的参考,小伙伴有遇到可以看看
https://stackoverflow.com/questions/68831025/kibana-health-prob-fails-when-elasticsearch-host-is-added-to-fluentd-forwarder-c
https://stackoverflow.com/questions/48540929/kubernetes-readiness-probe-failed-error
通过helm ls可以看到我们的EFK已经安装完成了
1 2 3 4 5 6 7 8 9 ┌──[root@vms81.liruilongs.github.io]-[~/ansible/k8s-helm-create] └─$helm ls NAME NAMESPACE REVISION UPDATED STATUS CHART APP VERSION elasticsearch kube-system 1 2022-02-05 03:15:45.827750596 +0800 CST deployed elasticsearch-7.9.1 7.9.1 filebeat kube-system 1 2022-02-05 03:27:13.473157636 +0800 CST deployed filebeat-7.9.1 7.9.1 kibana kube-system 1 2022-02-05 03:47:07.618651858 +0800 CST deployed kibana-7.9.1 7.9.1 metricbeat kube-system 1 2022-02-05 03:42:48.807772112 +0800 CST deployed metricbeat-7.9.1 7.9.1 ┌──[root@vms81.liruilongs.github.io]-[~/ansible/k8s-helm-create] └─$
pod列表查看所有的pod都Running了
1 2 3 4 5 6 7 8 9 10 11 12 13 14 15 16 17 18 19 20 21 22 23 24 25 26 27 ┌──[root@vms81.liruilongs.github.io]-[~/ansible/k8s-helm-create/metricbeat] └─$kubectl get pods -o wide NAME READY STATUS RESTARTS AGE IP NODE NOMINATED NODE READINESS GATES calico-kube-controllers-78d6f96c7b-85rv9 1/1 Running 327 (172m ago) 51d 10.244.88.83 vms81.liruilongs.github.io <none> <none> calico-node-6nfqv 1/1 Running 364 (172m ago) 54d 192.168.26.81 vms81.liruilongs.github.io <none> <none> calico-node-fv458 1/1 Running 70 (172m ago) 54d 192.168.26.83 vms83.liruilongs.github.io <none> <none> calico-node-h5lsq 1/1 Running 135 (3h25m ago) 54d 192.168.26.82 vms82.liruilongs.github.io <none> <none> coredns-7f6cbbb7b8-ncd2s 1/1 Running 33 (3h ago) 51d 10.244.88.84 vms81.liruilongs.github.io <none> <none> coredns-7f6cbbb7b8-pjnct 1/1 Running 30 (3h35m ago) 51d 10.244.88.82 vms81.liruilongs.github.io <none> <none> elasticsearch-master-0 1/1 Running 2 (3h21m ago) 3h55m 10.244.70.40 vms83.liruilongs.github.io <none> <none> elasticsearch-master-1 1/1 Running 2 (3h21m ago) 3h55m 10.244.171.163 vms82.liruilongs.github.io <none> <none> etcd-vms81.liruilongs.github.io 1/1 Running 134 (6h58m ago) 54d 192.168.26.81 vms81.liruilongs.github.io <none> <none> filebeat-filebeat-64f5b 1/1 Running 7 (168m ago) 3h54m 10.244.70.36 vms83.liruilongs.github.io <none> <none> filebeat-filebeat-g4cw8 1/1 Running 8 (168m ago) 3h54m 10.244.171.185 vms82.liruilongs.github.io <none> <none> kibana-kibana-f88767f86-vqnms 1/1 Running 8 (167m ago) 3h57m 10.244.171.159 vms82.liruilongs.github.io <none> <none> kube-apiserver-vms81.liruilongs.github.io 1/1 Running 32 (179m ago) 20d 192.168.26.81 vms81.liruilongs.github.io <none> <none> kube-controller-manager-vms81.liruilongs.github.io 1/1 Running 150 (170m ago) 52d 192.168.26.81 vms81.liruilongs.github.io <none> <none> kube-proxy-scs6x 1/1 Running 22 (3h21m ago) 54d 192.168.26.82 vms82.liruilongs.github.io <none> <none> kube-proxy-tbwz5 1/1 Running 30 (6h58m ago) 54d 192.168.26.81 vms81.liruilongs.github.io <none> <none> kube-proxy-xccmp 1/1 Running 11 (3h21m ago) 54d 192.168.26.83 vms83.liruilongs.github.io <none> <none> kube-scheduler-vms81.liruilongs.github.io 1/1 Running 302 (170m ago) 54d 192.168.26.81 vms81.liruilongs.github.io <none> <none> metricbeat-kube-state-metrics-75c5fc65d9-86fvh 1/1 Running 0 13m 10.244.70.43 vms83.liruilongs.github.io <none> <none> metricbeat-metricbeat-895qz 1/1 Running 0 13m 10.244.171.172 vms82.liruilongs.github.io <none> <none> metricbeat-metricbeat-metrics-7c5cd7d77f-22fgr 1/1 Running 0 13m 10.244.70.45 vms83.liruilongs.github.io <none> <none> metricbeat-metricbeat-n2gx2 1/1 Running 0 13m 10.244.70.46 vms83.liruilongs.github.io <none> <none> metrics-server-bcfb98c76-d58bg 1/1 Running 3 (3h13m ago) 6h28m 10.244.70.31 vms83.liruilongs.github.io <none> <none>
查看节点核心指标
1 2 3 4 5 6 ┌──[root@vms81.liruilongs.github.io]-[~/ansible/k8s-helm-create/metricbeat] └─$kubectl top nodes NAME CPU(cores) CPU% MEMORY(bytes) MEMORY% vms81.liruilongs.github.io 335m 16% 1443Mi 46% vms82.liruilongs.github.io 372m 12% 2727Mi 57% vms83.liruilongs.github.io 554m 13% 2513Mi 56%
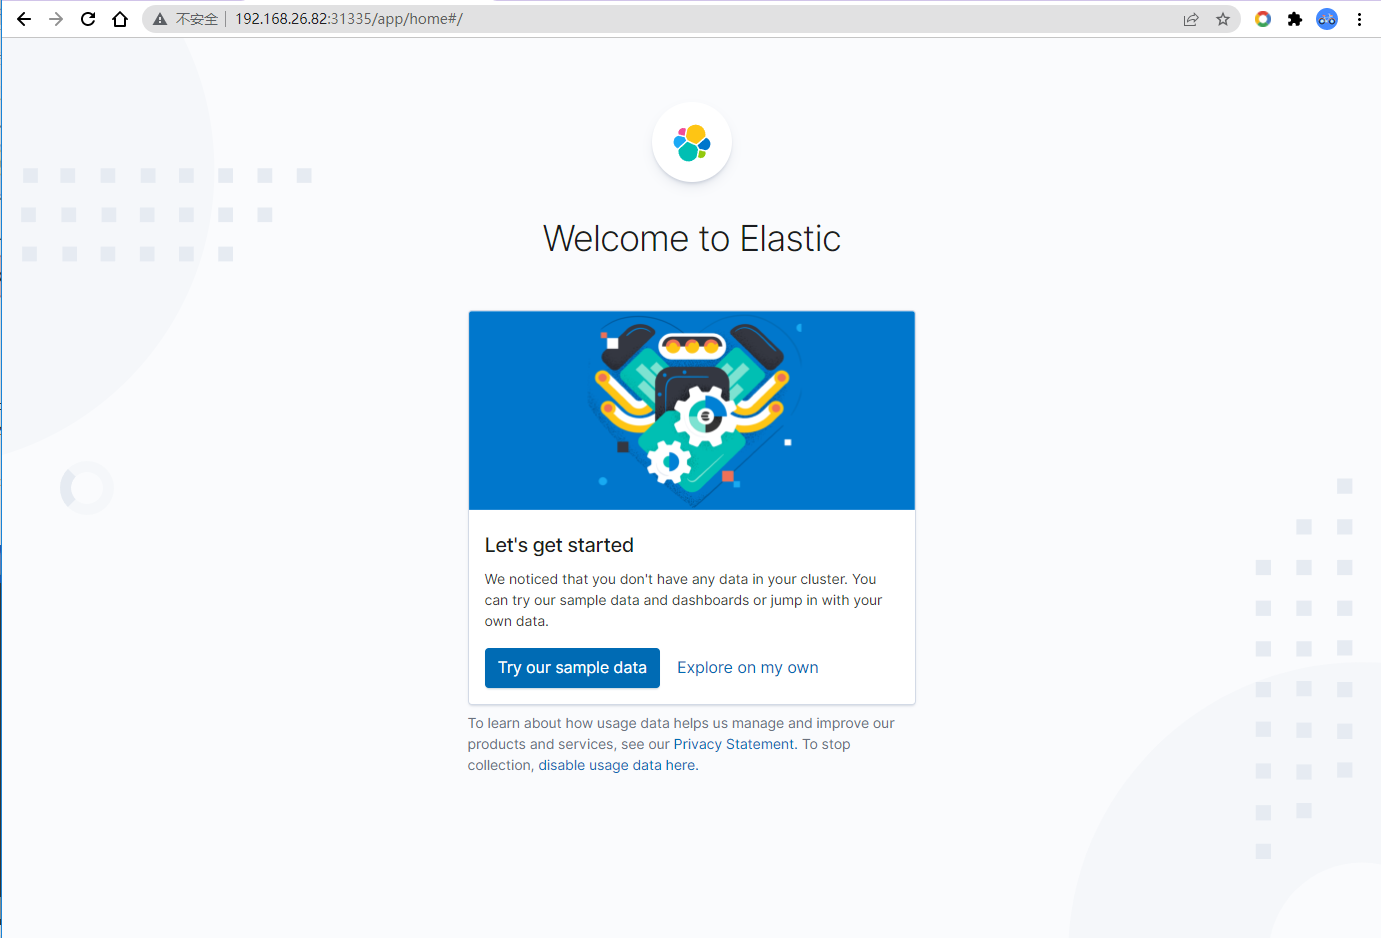
EFK测试 查看kibana对应的端口,访问测试
1 2 3 4 5 6 7 8 9 10 11 ┌──[root@vms81.liruilongs.github.io]-[~/ansible/k8s-helm-create/metricbeat] └─$kubectl get svc NAME TYPE CLUSTER-IP EXTERNAL-IP PORT(S) AGE elasticsearch-master ClusterIP 10.96.232.233 <none> 9200/TCP,9300/TCP 3h44m elasticsearch-master-headless ClusterIP None <none> 9200/TCP,9300/TCP 3h44m kibana-kibana NodePort 10.100.170.124 <none> 5601:31335/TCP 3h46m kube-dns ClusterIP 10.96.0.10 <none> 53/UDP,53/TCP,9153/TCP 54d liruilong-kube-prometheus-kubelet ClusterIP None <none> 10250/TCP,10255/TCP,4194/TCP 20d metricbeat-kube-state-metrics ClusterIP 10.108.35.197 <none> 8080/TCP 115s metrics-server ClusterIP 10.111.104.173 <none> 443/TCP 54d nginxdep NodePort 10.106.217.50 <none> 8888:31964/TCP 2d20h
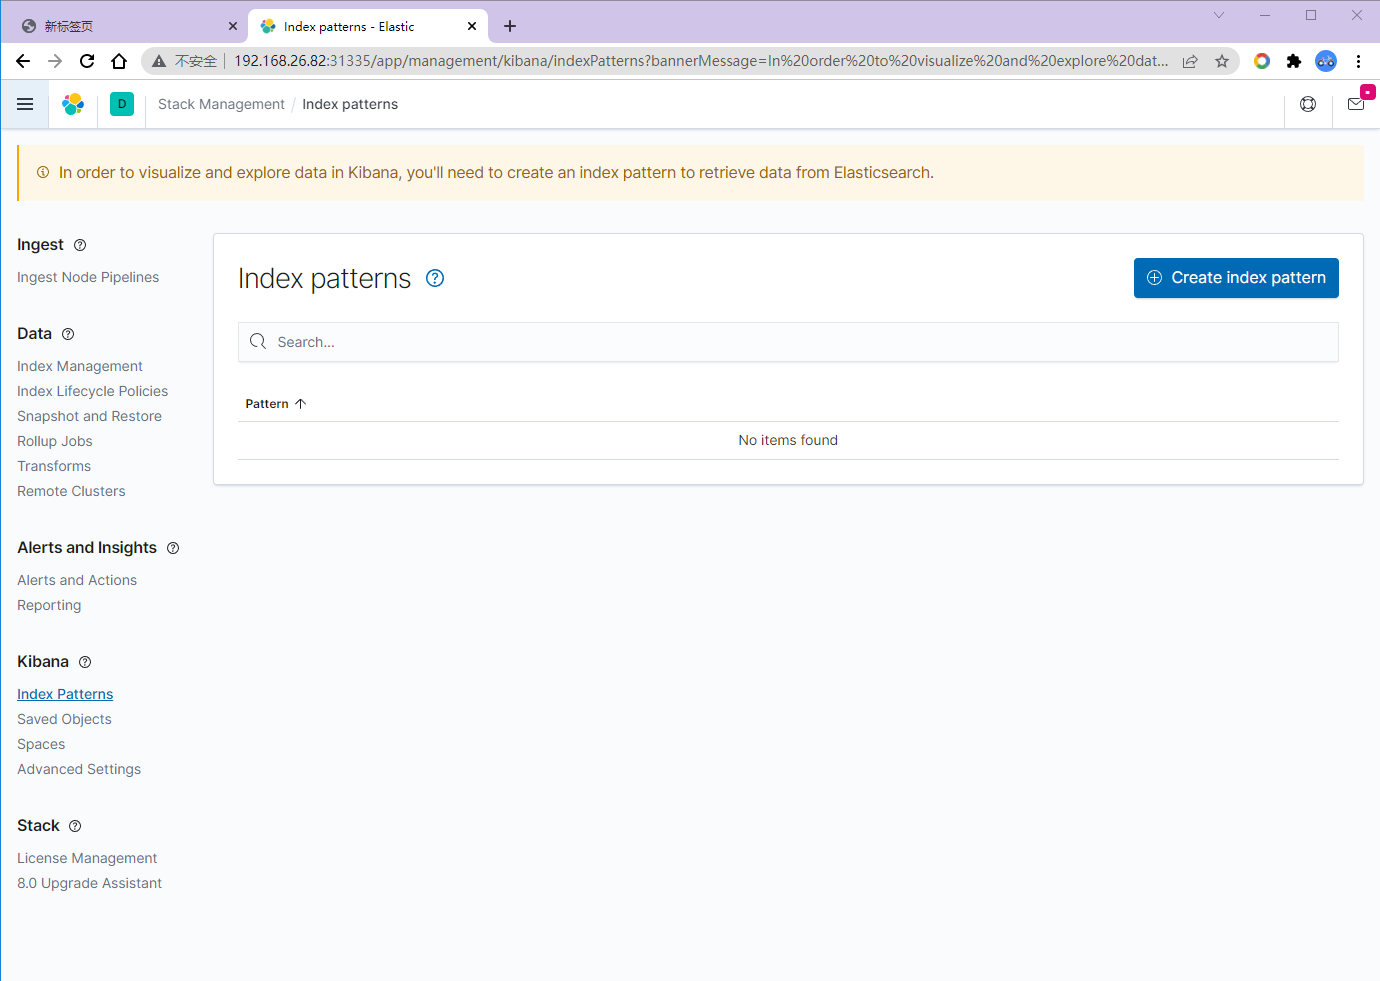
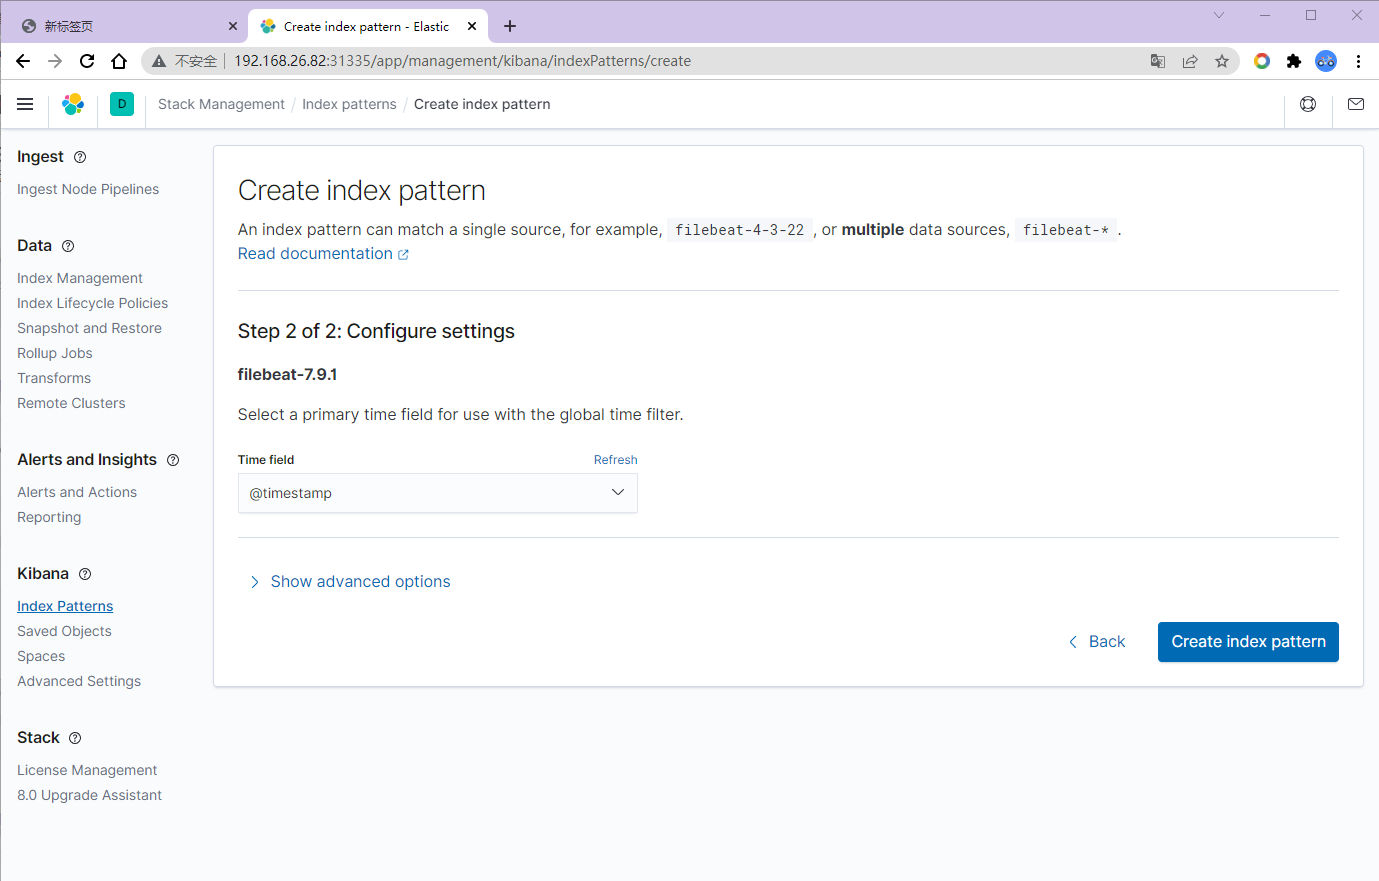
EKF测试,索引添加
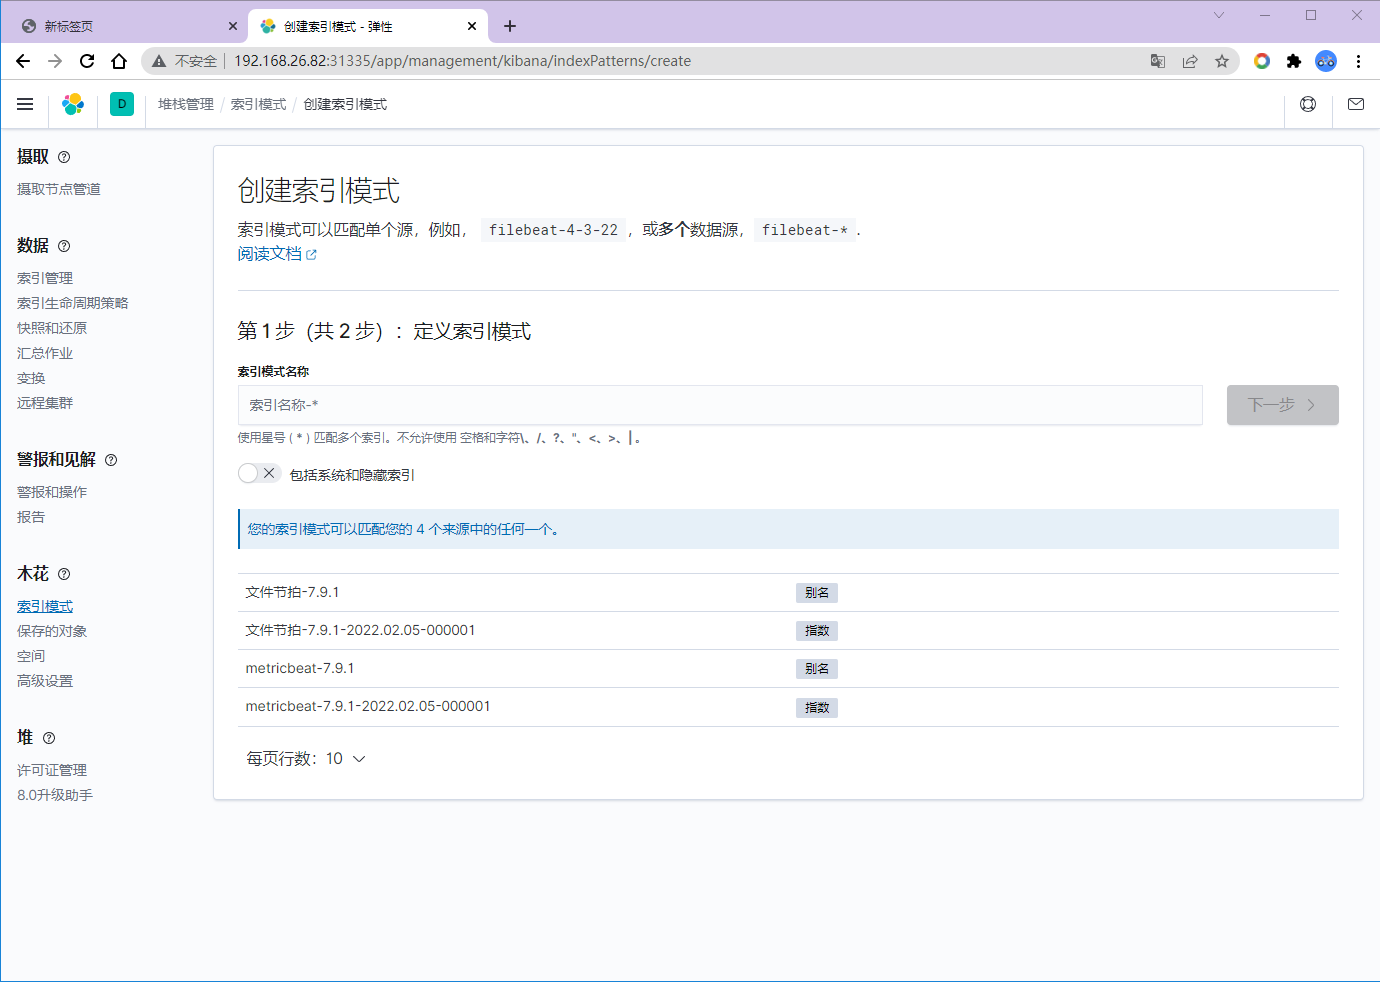
我们这里选择第二个,自定义
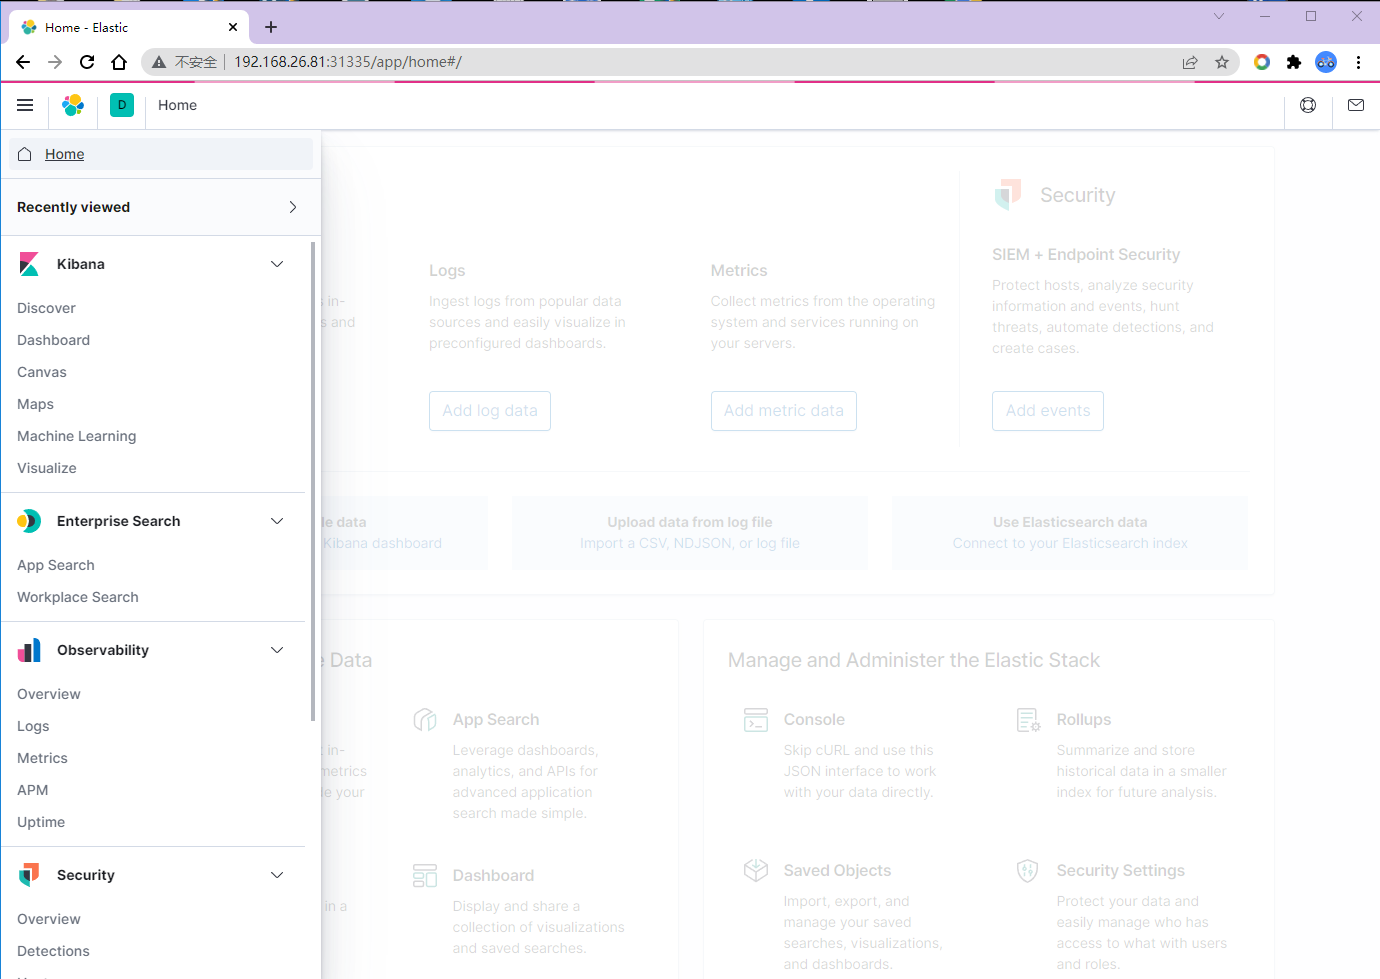
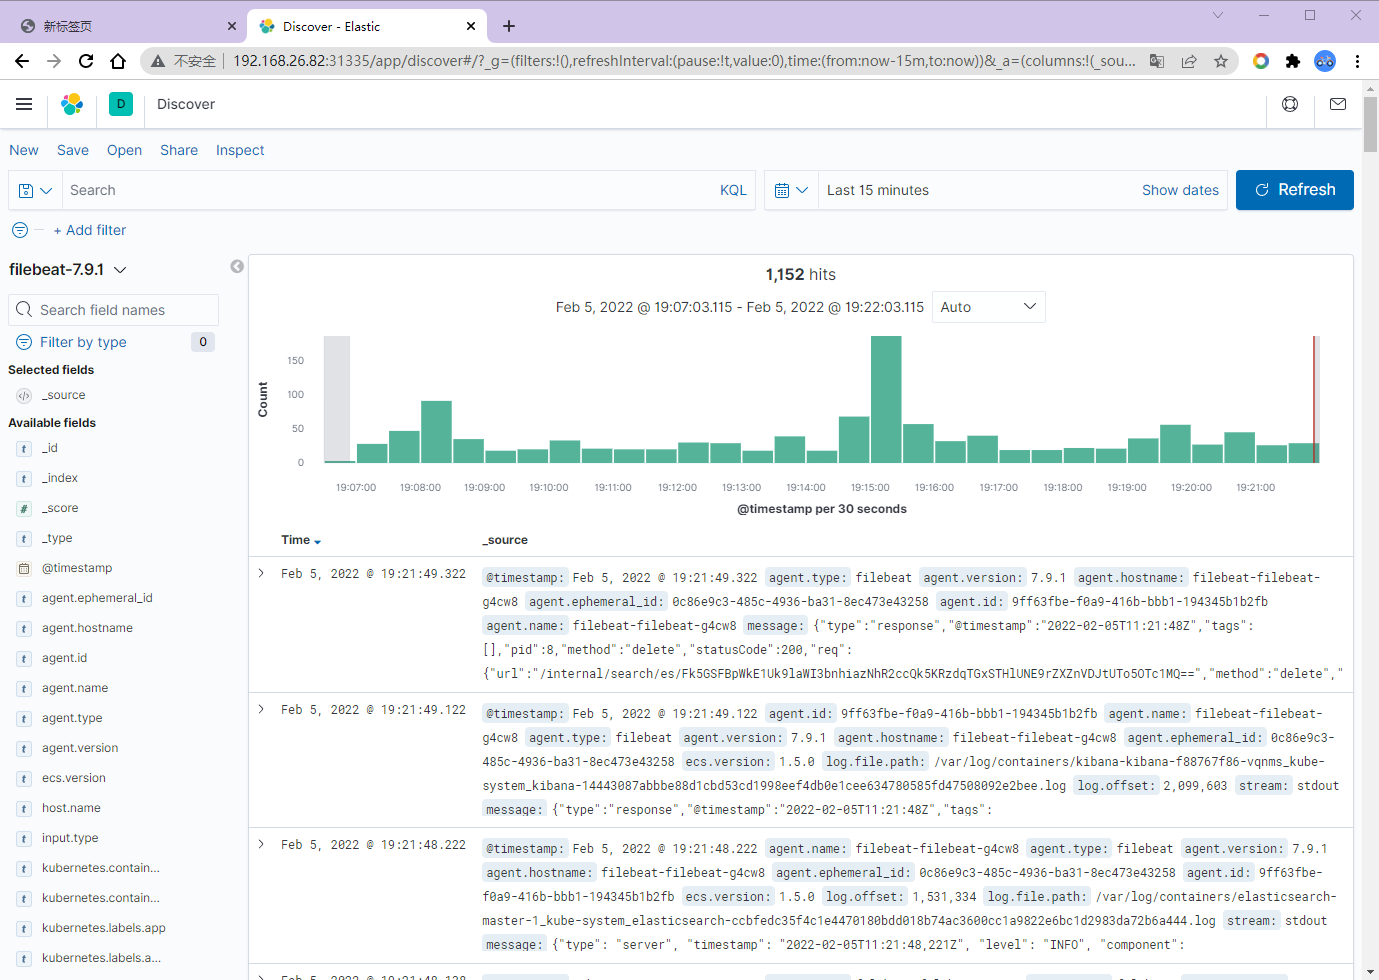
选择Discover
创建索引